Homemade Force Sensor


Nick Crews / June 20, 2021
32 min read • NaN views

I made a sensor which allows a computer to measure force. It can tell you (80 times a second) how hard something is squeezing or stretching it with an accuracy of around 1 pound, up to at least 3000 pounds. I machined the metal structure of it, built the electronics to interface with the sensor and communicate wirelessly with a computer, as well as wrote a python program to easily read and interact with the sensor on the computer using a graphical interface.
This was the subject of my senior physics thesis at Colorado College during the fall of 2017. I gave an hour long presentation to the physics department, and I made a poster as well if you just want a summary.
The inspiration for the project came from the rock climbing cam that I made, since I wanted to be able to measure how strong my cam was. When I started the project, I couldn't find a strong enough force sensor for a reasonable price. I expected (OK, maybe hoped) that my cam would be able to hold around the same as a commercial cam, about 1400 pounds. All the force sensors I found that could handle that load were a few hundred dollars. I thought that making my own sensor was the only option. As I write this, however, I just googled again and found a 1000kg force sensor for $50, so turns out the whole thing was unnecessary. But whatever, I still learned a whole lot, and my sensor works just about as well.
So, in ignorance of commercially available options, I decided to make my own, save some money, get some more experience with machining, electronics, coding, and experimentation, and push the boundaries of what is possible to do DIY style. Using the sensor I was able to measure the absolute strength of my cam, some other commercially bought climbing gear, and see how much force various climbing falls generate.

Theory and Overview

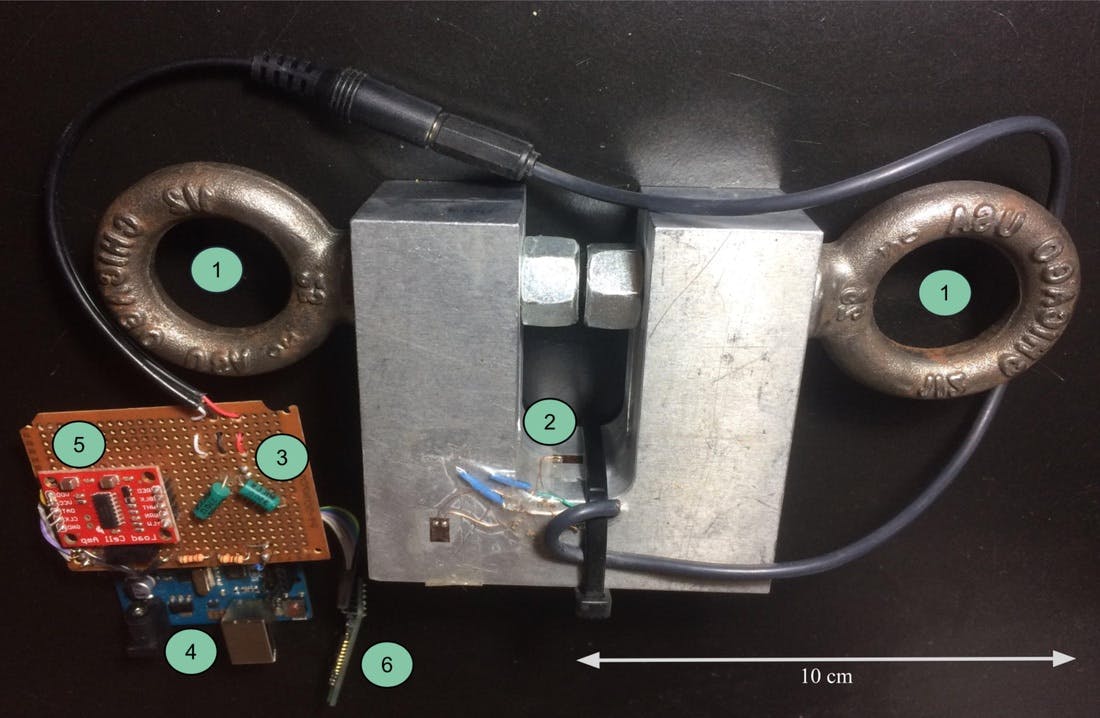
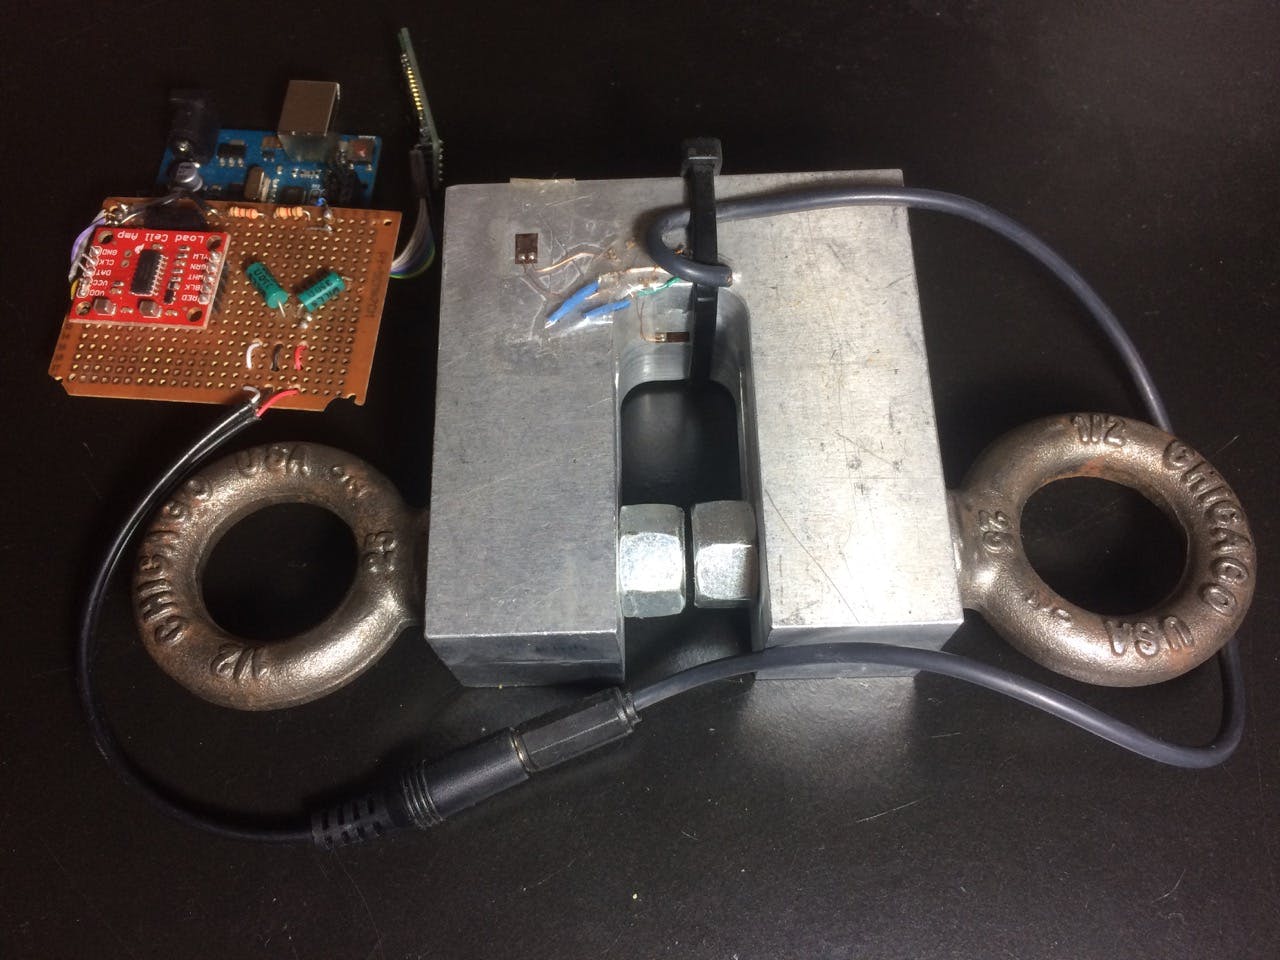
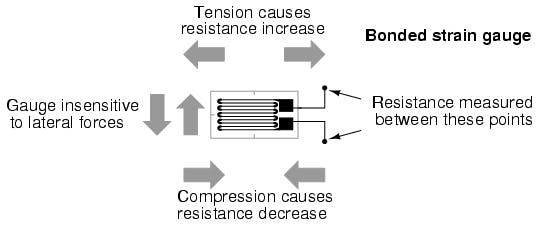
Force is applied to the eyebolts (1), which strains (stretches) the strain gauge (2) glued to the base of the "U." The electrical resistance of the strain gauge changes, and the Wheatstone bridge circuit (3) converts this change in resistance into a change in voltage. An Arduino microcontroller (4) (tiny computer) reads this change in voltage using an HX711 amplifier and analog-to-digital converter (5). The Arduino finally streams the readings to a laptop for storage and processing using a Bluetooth antenna (6).
Somehow we have to get from a force to a number that our computer can read which represents that force. The translation consists of a few different steps. If you don't read the rest of this page, focus on the 6 steps outlined below, they will give you a gist of the entire process. You could also read the poster I made for this project which can be found here.
- Translate a force into a small deformation of a material. When you pull on the aluminum body of the sensor, it bends and stretches.
- Use this movement to stretch and change the electrical resistance of a "Strain Gauge," a wafer-thin sensor covered in tiny wires.
- Use a circuit called a "Wheatstone Bridge" to translate this small change in electrical resistance into a small change in electrical voltage.
- Amplify this small change in voltage into a bigger change in voltage and read this into a tiny little computer called an Arduino.
- Send this data to our computer wirelessly via bluetooth, and then do cool stuff with it on our computer.
I'll be talking about some of the interesting physics that happen during the first couple steps, but if you want you can skip the explanation. You should be able to understand the rest of the project without this theory.
Stress to Strain Conversion
Quickly, some terms:
- Strain: the amount that a material stretches.
- Stress: the amount of internal force that develops in a material due to this strain, which usually tries to make the material return to its original shape. This is equal and opposite to the external force that must be applied to maintain this amount of strain. AKA "how hard you are pulling or pushing."
- Stress-Strain Curve: the relationship between these two quantities. For instance, you tell me how strained something is and I can tell you how much stress is in the object, and from this we can tell how much force is being applied to it.
Every material has a different stress-strain curve. For instance, with clay, when you stretch it, it doesn't rebound to it's original shape, so this means that the stress in the material is zero at any level of strain. A rubber band might have a stress-strain curve that looks like the graph below:

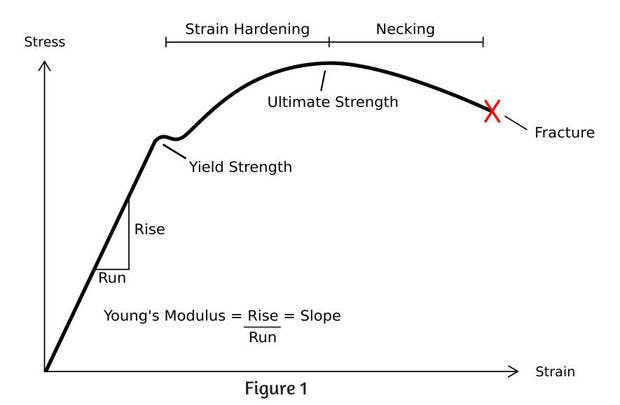
On the left side of the figure, at small amounts of strain, the rubber band has a linear stress-strain curve relationship: doubling the stretch results in double the restoring force. If you stretch too far, past the yield strength of the material, then the material might not rebound all the way back to the original shape. If you go past the ultimate strength, then the stress peters off, and it gets easier the farther you go.
Many everyday materials (including aluminum, the material that I made the sensor out of) have a stress strain curve that looks similar to the one pictured above. This is great, because if we don't exceed the yield strength of the material, and stay on the far left of the graph, in the so called "linear" or "elastic" region, it makes it easy to relate stress and strain to each other. All we have to do is measure the strain and stress at two different places along the curve (e.g. measure the strain with 0 pounds on the sensor and do the same with 10 pounds on the sensor), and then we can use these two data points to fit a straight line and predict the stress at any other strain level!
Additionally, many materials, including aluminum, have the property that they share the strain and stress consistently throughout the shape of the object. This doesn't necessarily mean that the strain and stress is the same everywhere in the object (usually it's not, as you could imagine), but that if you double the strain, the stress will double everywhere in the object. This is useful because it means that we can 1) build a shape that is more complicated than a simple bar that you pull on both ends, and 2) we can measure the strain anywhere we want in the object.
So now we just need a way of measuring the strain in our aluminum.
Strain to Resistance Conversion
(If you want some more math for the next two sections, this handout is very helpful.)
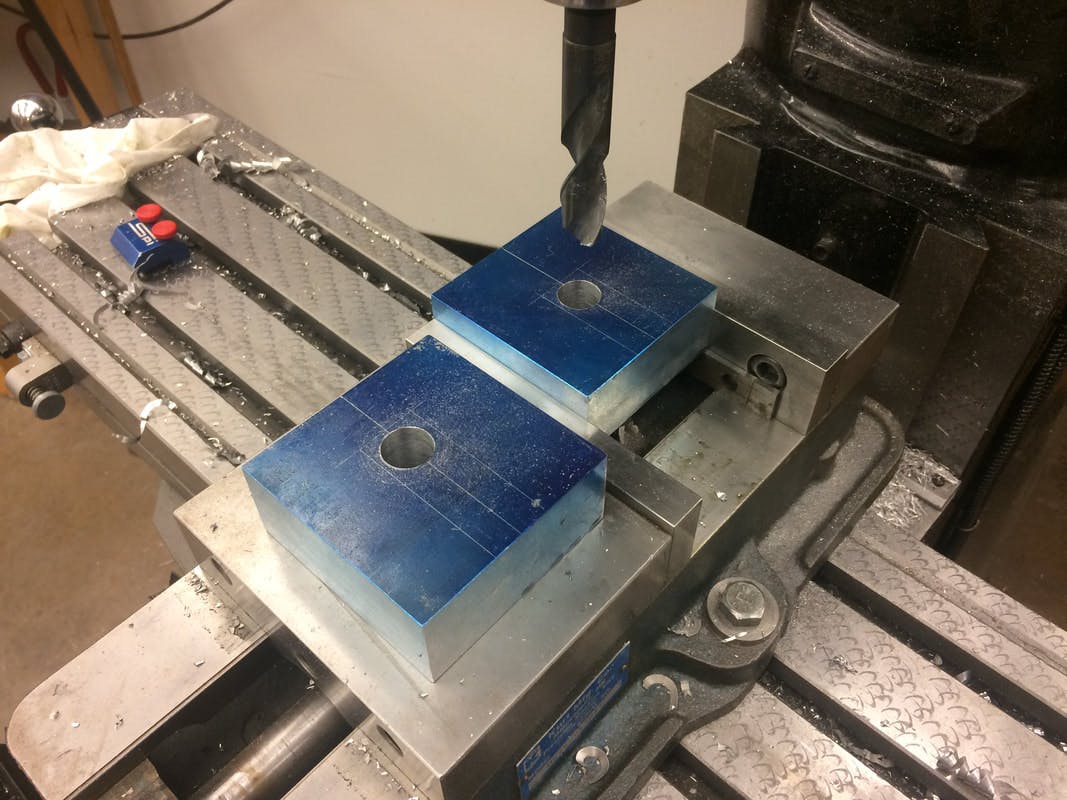
We measure the strain by using something called a strain gauge. A strain gauge is just a wafer thin pad about the size of a pinky nail that you glue onto your test piece so that it stretches along with the substrate material. Etched onto the pad are electrically conductive wires that wind back and forth, skinny and with lots of wraps in one dimension, and fat and with few wraps in the other.

Electrical conductors behave a lot like water hoses in terms of their resistance. It's a lot easier to push water through a short garden how than it is to push water through a really long straw. Similarly, it's a lot easier to push electrons through a short, fat chunk of metal than it is through a long, skinny wire. Thus, as the aluminum stretches, the strain gauge does too, and the length of the wires change, which changes the electrical resistance of the wire. Because the wires are etched asymmetrically on the pad, the gauge is only sensitive to strains along one direction.
It is a nice coincidence that this relationship between strain and resistance in conductors is a linear one (At least as long as we are in the realm of very small strains, which we are). This means that we preserve the linearity between stress and strain, so that the relationship between stress and resistance is also linear!
Awesome, so we're getting there, but a computer can't read a resistance directly. We need to convert this resistance change to a voltage, hopefully also using a linear relationship.
Resistance to Voltage Conversion
We use a circuit called a Wheatstone Bridge to convert the resistance change to a voltage change. This circuit is pictured below. You can also follow along and play with an online simulation of the circuit here.


Don't panic if you don't know anything about electronics, it's not too complicated! The lines are wires, the squiggly things, R1, R2, and R3 are resistors whose electrical resistances are constant, the pancake thing on the left is a battery which supplies a voltage, RG is the strain gauge whose resistance changes, and VMeas is the voltage difference between the - and +, where we read our output.
Pretend the battery is putting out 10 volts so the voltage at the top of the diamond is 10 volts and the voltage at the bottom of the diamond is 0 volts. Let R1, R2, and R3 all have a resistance of 100 ohms, and RG have a resistance of 100 ohms when it is unstretched. Since the resistance of R1 and R3 are the same, the voltage at the - in the center of the diamond will be halfway between 0 and 10 volts, so 5 volts. When the strain gauge is unstretched, the voltage at the + will be the same thing, 5 volts. Thus, the difference between the - and + is 0 volts, and this is what we measure as the output of our circuit VMeas.
OK, now say that we stretch the strain gauge and its resistance increases. Now RG > R2, so the voltage at the + is forced closer to the voltage at the top of the diamond, so now maybe it is 5.0000001 volts. Note that it is a realllllly small voltage change, since the resistance change is also realllllly small, since the strain is reallllllly small. Cool, so now VMeasure is .0000001 volts.
If we compressed the strain gauge, the opposite would happen, and VMeasure would be -.0000001 volts.
Similarly to the previous two conversions, we were careful to pick a circuit that has the property that the voltage varies linearly with the resistance (at least for small resistance changes, which is what we are dealing with), so now voltage varies linearly with stress!
Amplifying and Reading the Voltage
We're at the home stretch by this point. All we have to do now is amplify the voltage signal and then read it with the computer. Typically, the voltage signal coming out of the wheatstone bridge only a few microvolts, so we need to feed the signal into an "Instrumentation Amplifier" that can amplify this voltage change without corrupting the signal with a bunch of noise. Then, we have to convert it into something the computer to understand using a process called analog-to-digital conversion (ADC). I used a prebuilt circuit for the amplification and ADC called the HX711. It was easy, accurate, and only cost $10.
Then I read the digital signal from the HX711 with an Arduino, which is a kind of tiny, cheap, really primitive computer called a microcontroller. It could be powered by batteries and kept remotely with the sensor, and would provide a nice interface between my main computer and the rest of the project. To use the Arduino, you plug it into your main laptop, program it there, and then you can unplug it and it keeps ticking away, running its program as long as it is powered by a battery pack.
Once the Arduino has read the scale, the Arduino can send that data to the computer for analysis over USB or Bluetooth.
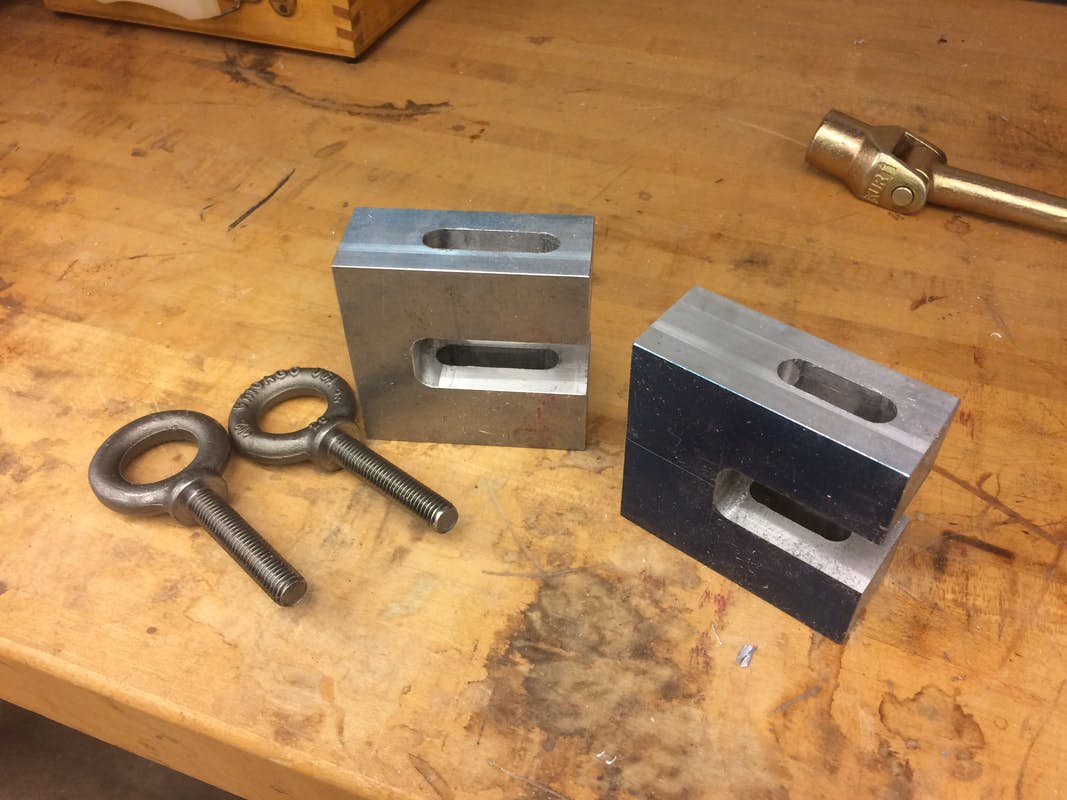
Hardware

The hardware of the sensor consists of a “U” shaped block of aluminum, with two eyebolts attached to either side of the U. You clip onto these two eyebolts and use them to pull or push on either side of the U. As you do this, the inner part of the elbow of the U gets either squished or stretched, depending on which way you are applying the force. Glued onto the inner surface of the elbow is a tiny sensor called a strain gauge. It is a wafer thin foil tab about the size of a pinky nail, with electrically conductive wires drawn onto it. As the aluminum stretches, the strain gauge stretches too, which changes the electrical resistance of the wires etched onto its surface. Using a circuit, we can measure this change in electrical resistance to determine how much the aluminum U was getting stretched, and thus how much force was applied.
How Big Should it be?
It was difficult to figure out how big exactly the U should be. If I made it really big, then it might not bend enough for the strain gauge to be able to measure anything. If the U was too small, then it might break under the loads that I wanted to measure, which as you could imagine would be not super duper safe. Somehow I needed to pick the right size and beefiness of the aluminum U so that it would bend some, but not too much, under the load I wanted to measure of a few thousand pounds.
At first, I tried to figure out how large the U needed to be using software designed for modeling materials called Pycalculix. I drew the shape of the aluminum U, added some forces on either side, and it would calculate a diagram of the stresses and strains throughout the object. By tweaking the dimensions of the U I was hoping to get the stresses and strains to the correct levels. However, I don’t think I was using the software correctly, since I was getting numbers that were totally unreasonable, and I didn’t want to sink a bunch of time into learning the software. Therefore, this wouldn’t work for figuring out how big to make the U. This process was useful though, even if the absolute numerical results were useless, since the plots confirmed that the stresses would be nice and smooth around the inner curve of the elbow, and this would be the location with the highest strains in the entire piece, so it would be a good location to get the maximum range out of the strain gauge.
After the failure of pycalculix, I resorted to finding the correct size of U by using the age-old problem-solving technique of guess-and-check. I would start with a U block of aluminum that was too big and for sure strong enough, and gradually make it less strong and more sensitive. There were two ways I could do this. First, I could make the elbow of the U skinnier by shaving off the back of it using the mill. Second, I could change the amount of leverage that the load would actually exert on the elbow by making the eyebolts movable along tracks on either side of the U: The further the eyebolts were from the elbow, the greater the force at the elbow, and the closer to the elbow, the smaller the leverage and the resulting force. Both of these techniques were attractive because they could be done without having to remove the strain gauge once it was attached, so it would be easy to make modifications if the readings from the strain gauge weren’t big enough.
I also decided to make a second U with an even thicker elbow, in case the first one turned out to be too weak to start with.
Shaping the Block
I started with a raw block of 6061 alloy aluminum that was about half the size of a textbook. I went with aluminum because it is fairly strong, and it has the property that it stretches linearly with the amount of force applied. If you read the post on theory I talk more about this stress-strain relationship and why it is important.
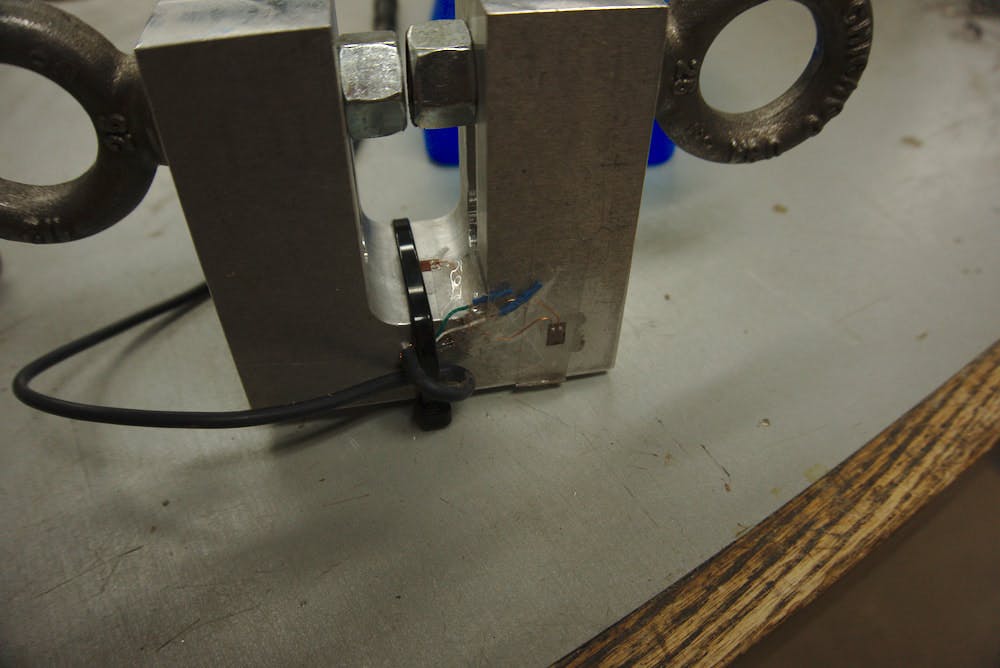
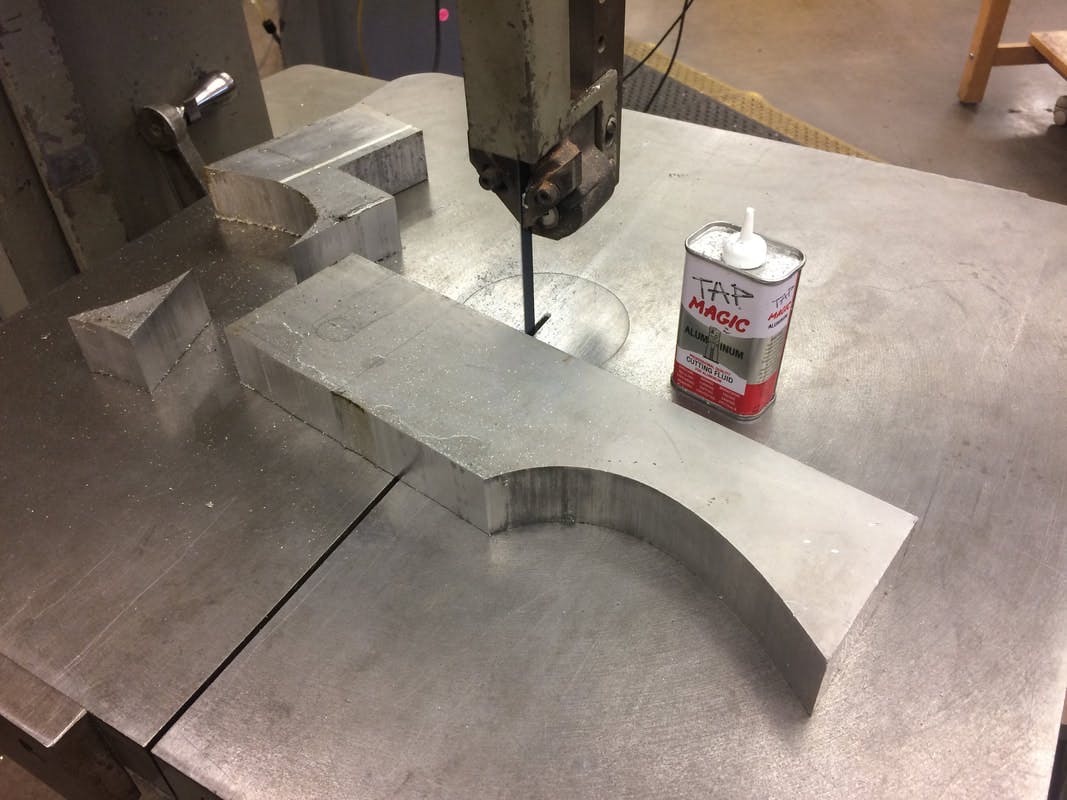
Then, I turned the block into a U shape. First, I used the bandsaw to cut the raw stock into a rectangular block of approximately the right size. Then, I drilled out a hole in the middle of the block. This would become the smooth, round, inner elbow of the sensor. I couldn’t make inner corners of the elbow be sharp right angles for a few reasons. First, the entire surface needs to stretch uniformly so that we get an accurate measurement with the strain gauge. If there were abrupt angles, different parts of the surface might stretch different amounts. Secondly, a smooth curve is a lot stronger, since stress becomes concentrated around sharp corners. It could be really bad if the sensor breaks when we don’t expect it. Next, I took this “donut” and used the bandsaw to cut out a slice of the donut so that I was left with a U shape. Then I used the mill to smooth up all of cuts so far on the inner surface. At this point, the general shape was there, but now I had to attach the eyebolts on either side of the U. I milled out tracks for them so they could be slid along the length of either arm, and then fixed in place by tightening some nuts.
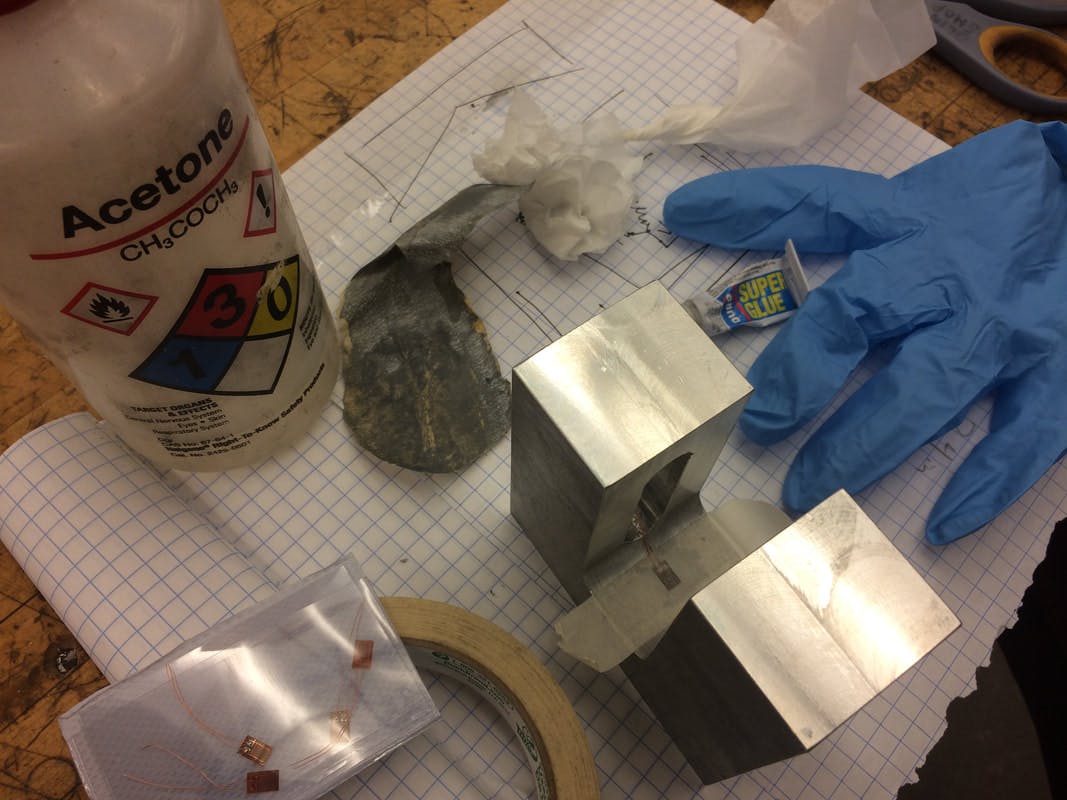
Attaching the Strain Gauge
The first step to attaching the strain gauge is to prep the surface. We want the gauge to stretch exactly in sync with the aluminum underneath it, so the bond between them has to be perfect. I sanded the surface of the aluminum with fine sandpaper so that it is smooth, but with a tiny bit of texture that the glue will adhere to. Then I used acetone (nasty stuff that’s like paint thinner or nail polish remover) to clean any oils or other chemicals from the surface. At this point I put on latex gloves to minimize chance that my skin oils would contaminate anything, and used tweezers to take the tiny strain gauge out of its sterile packaging. Now I had to glue the gauge onto the inner surface of the aluminum U’s elbow so that it was perfectly centered and alligned. This would be really hard to do freehand, so I used a cool trick. First I used a piece of scotch tape to pick up the gauge from the back, and now I had the two really good handles of the tape to place the gauge exactly. With this technique it was pretty simple to get the gauge right where I wanted, and the tape held it exactly in its final position. Now all I had to do was peel up one edge of the tape so that the gauge-aluminum interface was exposed, put a dot of glue onto the gauge, and then roll the tape back down so the gauge returned to its exact original position. The glue of choice for attaching strain gauges is actually just common super-glue. It’s really strong, it sets quickly, and unlike some other glues such as epoxy, it is also really stiff, so the gauge’s movement is totally coupled to the aluminum’s. After adding the glue and rolling the gauge down, I pressed on it with my thumb to ensure a good tight bond. After five minutes the glue was supposed to be set, but on the first two attempts it was still totally liquidy when I pulled away my thumb. I was getting nervous that my glue was shot, the aluminum was weird, and that I was going to run out of strain gauges, since I only had four total. But after some research I discovered that super-glue is activated by moisture in the air, so the low humidity of Colorado was messing things up (#coloradoproblems). So I tried a third time, but this time held the dot of super-glue over a bowl of steaming hot water before pressing it down, and this time the glue stuck. Boom.
I did the same procedure for a second strain gauge on the unstressed edge of the U, since as you will see in the circuit section, I wanted a second gauge to act as a baseline. This made it so there would be some constant against which I could measure the primary strain gauge, and any temperature effects on the primary gauge would be canceled out by an equal temperature change in the secondary. I soldered some beefy cable to the leads of the strain gauges and then zip-tied this cable around the U so that any jerks on the cable wouldn’t damage the gauges themselves. Finally, I put scotch tape over the actual gauges so that they would be a bit better protected. At this point everything looked pretty good, but it was impossible to tell if I had messed something up. It was time to build some circuitry and see!
Circuitry
Now that the hardware was done, I somehow needed to translate the tiny resistance change of the strain gauges into something that the computer could understand, and then send it to the computer. There are a few different components of this:
- A simple circuit called a "Wheatstone Bridge" which takes the small resistance change from the strain guages and turns it into a small voltage change.
- An Arduino Microcontroller which acts as the central brain, reading information and sending it to the computer. An Arduino is a really small, cheap, low processing power computer that can run simple programs and is easy to interface with hardware.
- A voltage amplifier and analog-to-digital converter acting as the middlewoman in between the Wheatstone Bridge and the Arduino. It takes the tiny voltage change, boosts this into a moderately sized voltage change, and digitizes it into a binary number of 0’s and 1’s that the computer can understand. I used a HX711 board that was designed for this purpose.
- A Bluetooth dongle, which the Arduino can use to send information to the computer.
I made the Arduino and Bluetooth module easily removable from the rest of the circuitry so that I could use them in other projects if I wanted. Everything else is soldered around a little bit of circuit board.
Each of these components will get its own section, so you can learn more about them below.
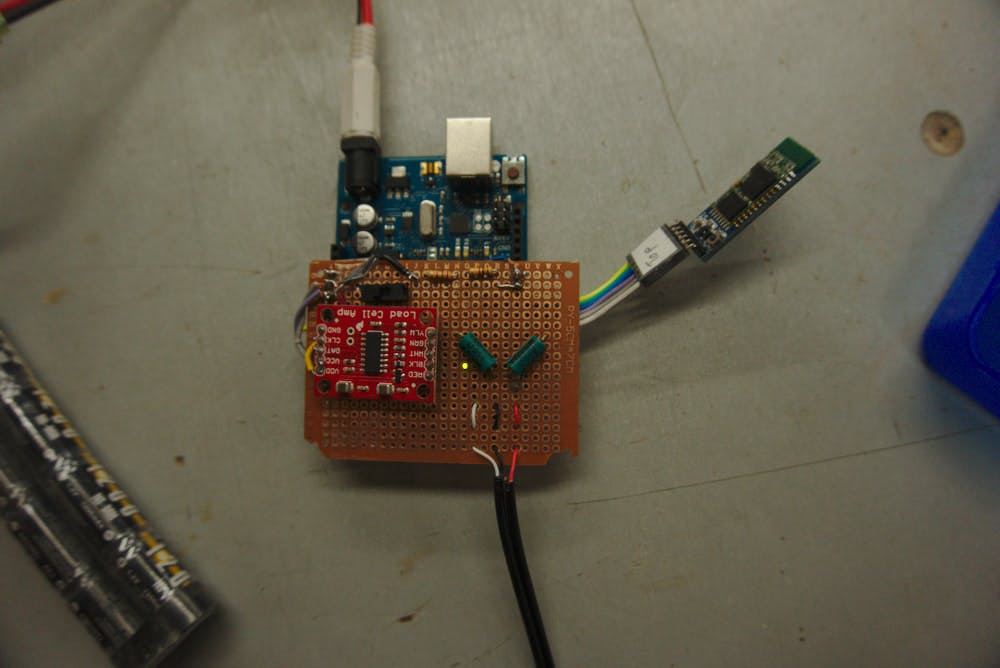
Above is a picture of all the circuitry. The red rectangle is the HX711 Load Cell Amplifier Breakout Board from Sparkfun. The two smaller green cylinders are two of the resistors of the Wheatstone bridge. The other two resistors are the actual strain gauges on the force sensor, hooked up remotely. The dangly thing off right is the bluetooth antenna. The blue board underneath the brown board is the Arduino.
Wheatstone Bridge Circuit
If you read the page on theory then you should know how a Wheatstone Bridge works. I made one using some fancy resistors that were given to me by Jeff Steele, the Technical Director and resident lab genius of the Physics Department. Thanks Jeff! The resistors are fancy because they have a very precise, constant resistance that won’t add much noise to the resistance change signal coming from the strain gauges.
To connect the sensor to the circuit I used a standard 3mm headphone audio jack. This made it easy to connect and disconnect the circuit and the sensor from each other. At first I just used some cheap individual male-female jumper cables here for each individual lead, but that did not work: Whenever any of these connections was wiggled, the resistance within the connection would change enough to throw off the reading. When your “signal” comes from a few millohms of resistance change within the strain gauges, it is really easy for bad connections to introduce noise that covers up this signal. In fact, just putting your finger over the top of the gauges raises their temperature enough that their resistance changes, and the final reading is off by up to 10 pounds! To further reduce contributions from noise, I made the wires and cables as short as possible so they would not act as antennas and pick up any of the stray electromagnetic noise that is generated by the millions of electronic devices with which we surround ourselves. As you can see, I was trying to be as careful about minimizing noise as possible. The signal from the strain gauges was very small in relation to all of the other things in the circuit which could possibly change their resistance.
HX711 Amplifier and ADC
I bought this board online for about $15. It was designed specifically for interfacing between a load sensor/wheatstone bridge and an Arduino, so it was really easy to use. Plug in a few cables into the bridge, plug a few more into the Arduino, and we’re pretty much good to go.
The analog-to-digital converter (ADC) in the HX711 can sample the voltage at a rate of either 10 or 80 samples-per-second. Since I wanted to be able to drop weights onto climbing equipment and be able to measure the forces during those sudden impacts, I wanted to be use the highest possible sample rate. To do this I had to scratch off a little trace of wire on the backside of the board which acted like a switch, which turned the board from 10SPS to 80SPS mode.
I was hesitant that even 80 SPS would be fast enough, since a climbing fall can be over within a quarter of a second, and I was partially right. When I did tests of a falling “climber” onto a stretchy rope that simulated a lead fall, the ADC could keep up and the plot was a fairly smooth curve. However, when I tested a falling climber on a very static(non-stretchy) dyneema sling, the plot was a sudden peak and then flatline. The sling stopped the fall too fast, within 1/20th of a second, so I only got a few data points, and thus perhaps it missed the actual peak force that it took to broke the sling. Oh well, I might have to figure out some other method of ADC, but until then the HX711 works great!
Arduino Microcontroller
I used an Arduino Uno that I’ve had for a few years that I’ve used for various other projects. You write code for the Arduino on your computer, and then upload it to the Arduino using a USB cable. Then you can unplug the cable and the Arduino will just start running the program you wrote as soon as it gets power.
At first I powered it using either a wall plug and cable or USB cable to computer, but when I decided I wanted everything to be wireless I had to come up with something better. So I took an old airsoft gun battery that I had saved and soldered up a connection that would plug into the Arduino.
Software
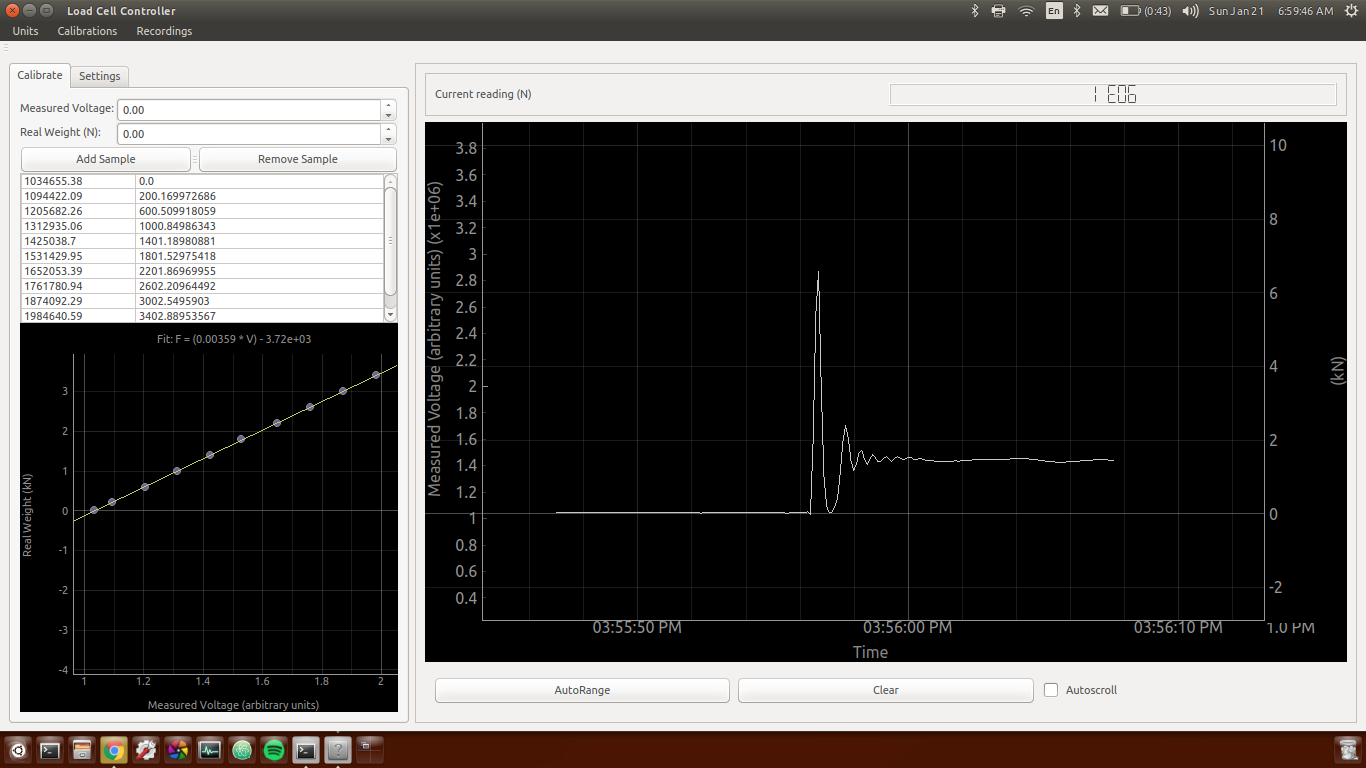
So we've managed to convert a force into a voltage. How the heck do we read and interpret this? First of all, we use the Arduino to read the voltage, and then send the reading via bluetooth or USB to a laptop. On the laptop there is a GUI (Graphical User Interface) python program that allows us to view the readings and interact with the sensor. We can select which sensor to connect to (in case you have multiple lol?), what sample rate we want to use, and what baudrate to use for a USB connection. Then, the readings received are displayed on a dynamically updating plot. You can calibrate the sensor using the program too, by taking sample points of known voltage and weight, and then doing a linear regression to find the line of best fit. After calibrating, all the readings can be displayed with their real weight. It is also possible to save and load these calibrations, as well as recordings of what the scale reads, so you can go back and interpret experiments from the past.
All of the code can be found on a GitHub, as well as a pretty decent description of what is going on.
Arduino Code
For the Arduino I wrote a really simple program that just queries the HX711 for a reading as quickly as possible, and as soon as the Arduino gets a response it emits that reading over both the USB cable and the bluetooth module. A computer can just listen in on either of these two lines of communication. I wanted the Arduino program to be as simple as possible so that it would be as fast as possible, and to minimize the amount that I would have to plug it back in and re-upload code to it. I left a lot of the calculations to the computer, such as figuring out a timestamp that a reading was recorded.
Laptop GUI
This was the bulk of the code. I wanted it to follow a nice Model-View-Controller Architecture, so a lot of the logic is separate from the actual visual representation on the screen
"View": loadcellcontrol.UI, basicgui.py, and gui.py
The GUI is built using PyQt, a python library for GUI programs. I designed the layout of the GUI using the program called Qt Designer. It allows you to drag and drop elements of a GUI such as buttons, text boxes, tabs, windows, menus, and more, and set some of their basic behavior such as how they resize when you make the window larger or smaller. The output of Qt Designer is a file with a .ui extension that describes the layout of you GUI using a JSON-like syntax, with hierarchies of tabs, windows, and elements. PyQt contains a function for translating this .ui file into actual python code that will actually create the GUI. At the beginning of every program run I recompile the .ui file into python code in the basicgui.py file.
However, this code only defines the looks of the GUI, and doesn't create any of the complex behavior that a GUI needs such as "When you click this button, we need to get the entry from this text box, add it to the database, display in on the graph." I added this functionality in a file called gui.py. This is probably the most complicated part of the program, because there were so many little behaviors that I had to tweak. It also is some of the most boring code, so I don't want to get into it too much. However, it is good to note that I used the library pyqtgraph for plotting the calibration and the incoming data.
"model" and "Controller": loadcellcontrol.py
That is all the "View" portion of the application. The "Model" and "Controller" portions of the application are taken care of in loadcellcontrol.py. Here is where I store all the calibration and recording data (the "Model"), as well as manage communication between the GUI and the Arduino, and deal with saving and loading data (the "Controller").
Other: scale.py
Finally, the other piece of the application is scale.py, which is basically an Object-Oriented interface to talk with the Arduino over USB or Bluetooth, or to create a dummy scale which generates bogus readings, in case you want to test the GUI without actually using a real force sensor.
Something interesting to note here is my use of multiprocessing: The Arduino is constantly streaming readings to the computer, and I want to be able to receive them as soon as possible so that they are recorded at an accurate time, and so that the buffer which holds incoming USB and Bluetooth traffic does not overflow. Without multiprocessing (multithreading isn't an option with python because of the Global Interpreter Lock, blahblahblah who cares), too much of the computer's CPU time could be held up doing calculations for the GUI, so we might be late on reading from the scale. So there is some fun multiprocessing stuff going on in here!
Results
The sensor was calibrated in the Colorado College varsity weight room. Ten voltage readings with weights up to 765 lbs (347 kg) were sampled so that a fit could be found between force and voltage.
After a fit was found from the calibration, drop tests were performed in the Ritt Kellogg Climbing Gym to measure the forces generated during various types of climbing falls on several materials. The three scenarios tested were large falls (7.3m) on dynamic (stretchy) climbing rope using a dummy weight (pictured), smaller falls (~2m) with people as weight, and short (<1m) falls on static (non-stretchy) nylon and dyneema slings using the dummy weight.
Below are some videos of the various drop tests. More videos can be found on Google Drive.
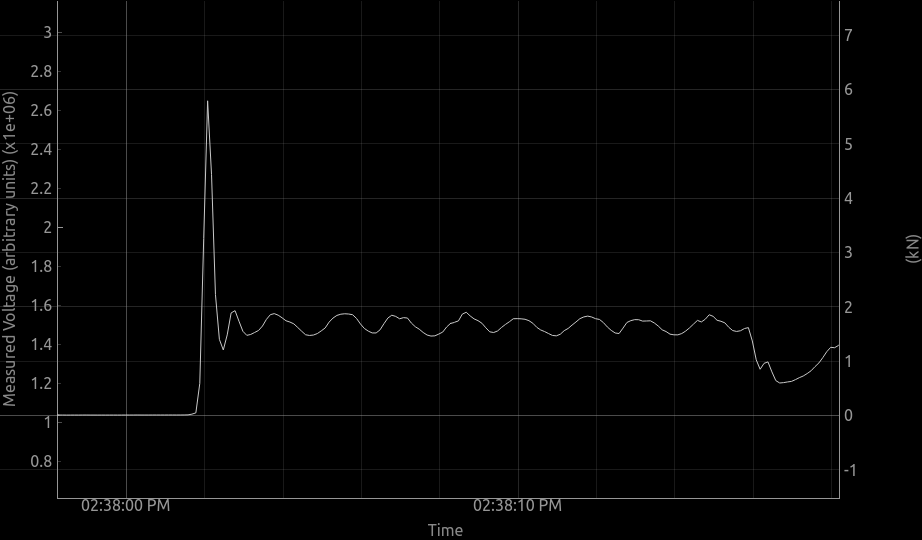
Large Dynamic Fall
A large fall using an 85 kg dummy weight on a dynamic (stretchy) climbing rope.

The sensor mostly managed to capture the signal of the fall, though perhaps the sample rate wasn't high enough, and it missed the peak force. It looks like the peak force was 6.5kN.
Small Dynamic Fall
A smaller fall, still on a dynamic rope, with me as the weight (80 kg).
It looks like the peak force was nearly 6kN, almost the same as the huge fall above! Tiny falls can rip out your pieces of protection just as much as huge falls! This is why we care about the fall factor, and not the actual fall distance.
Again, the sensor sample rate may not be high enough.
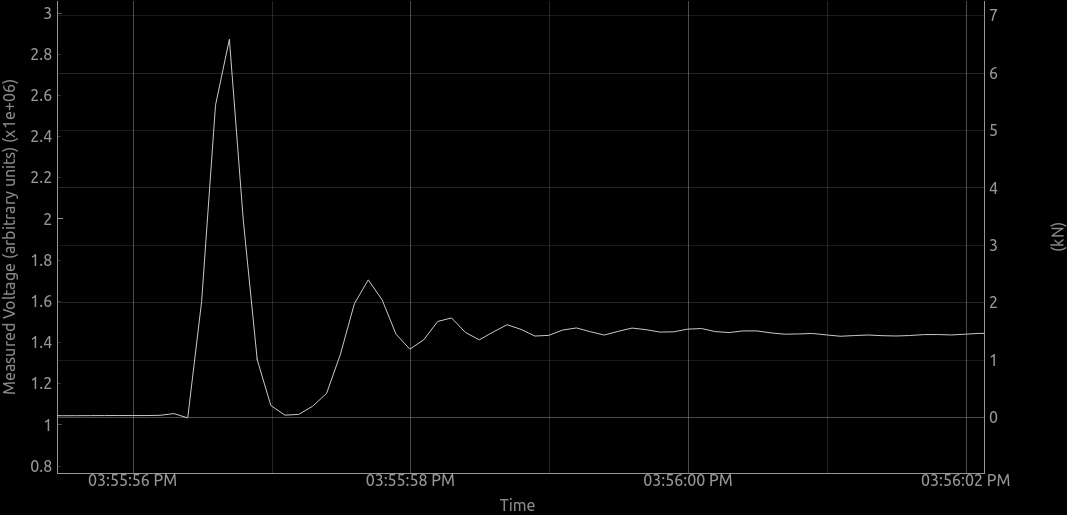
Breaking a Static Sling
Using the 85kg dummy weight I was able to break a static (non-stretchy) dyneema sling. This is why, when climbing, you shouldn't tether yourself to an anchor using a static material. Even a tiny fall can break them from the shock load!
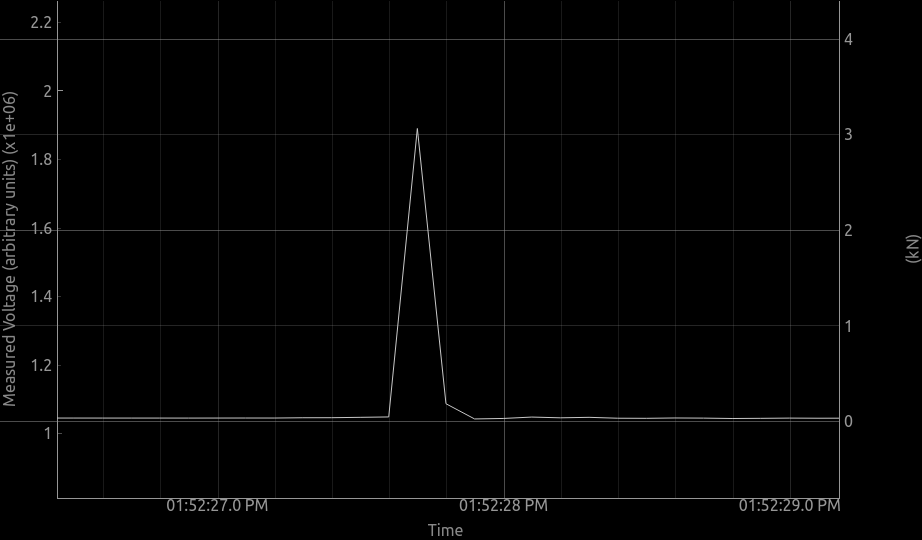
The sensor sample rate definitely isn't high enough, it definitely missed the peak force. The sling definitely broke at more than the 3kN that the sensor reported.