Wildfire AI


Nick Crews / August 09, 2021
7 min read • NaN views
For my Computer Science thesis at Colorado College, I worked on a team of three to build an application that uses an artificial neural network to predict the spread of forest fires using satellite imagery, elevation maps, and weather data. Our team was invited to Capitol Hill in Washington to present our research to members of congress at the Posters on the Hill conference.
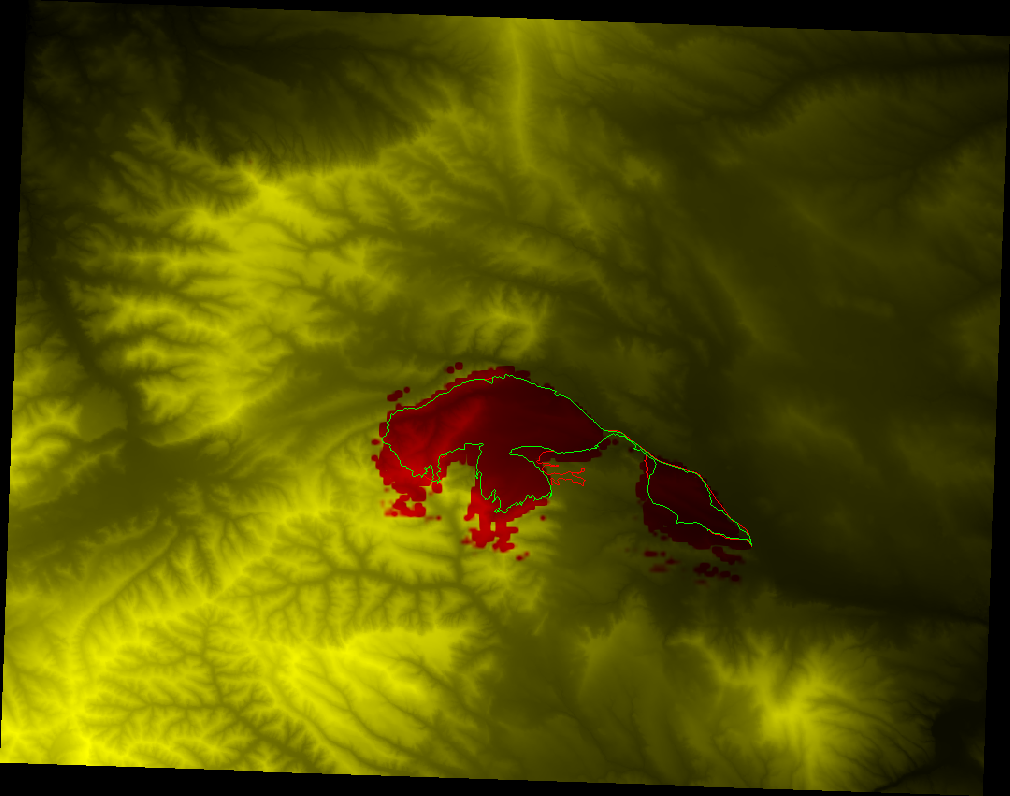
Above is an example map of predictions from the model. The green outline is the perimeter of a fire on one day. The red outline is the perimeter of the fire on the next day. In other words the fire spread from the green outline to the red outline over one day. The background yellow/red tint is the prediction of the model: yellow means the model thought that area would not burn, red means the model thought that it would burn. The skeletal dark/light shading behind everything is the topographic map of the area, so you can see how the fire behaved in the mountainous terrain.
You can find our project on GitHub (It's always a good sign when you look back on past code and are embarrassed, that is an indication that you are learning things 😂). My colleague David Radke continued to work on the project as a graduate student at the University of Waterloo, and published a paper for the International Joint Conference on Artificial Intelligence in 2019.
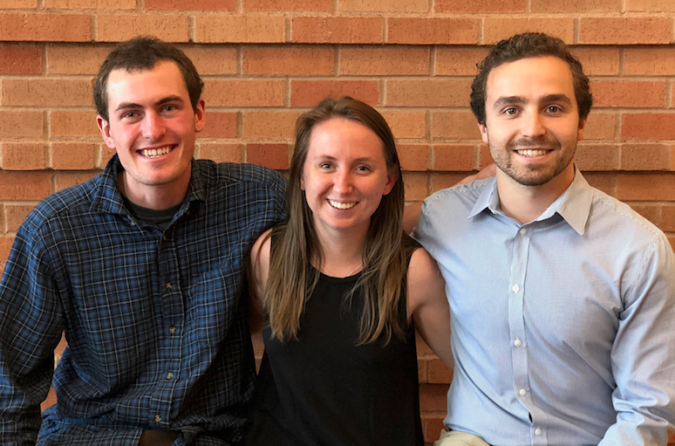
Above you can see my fellow researchers and me. From left to right are me, Anna Hessler, and David Radke. Not pictured is our advisor Daniel Ellsworth.
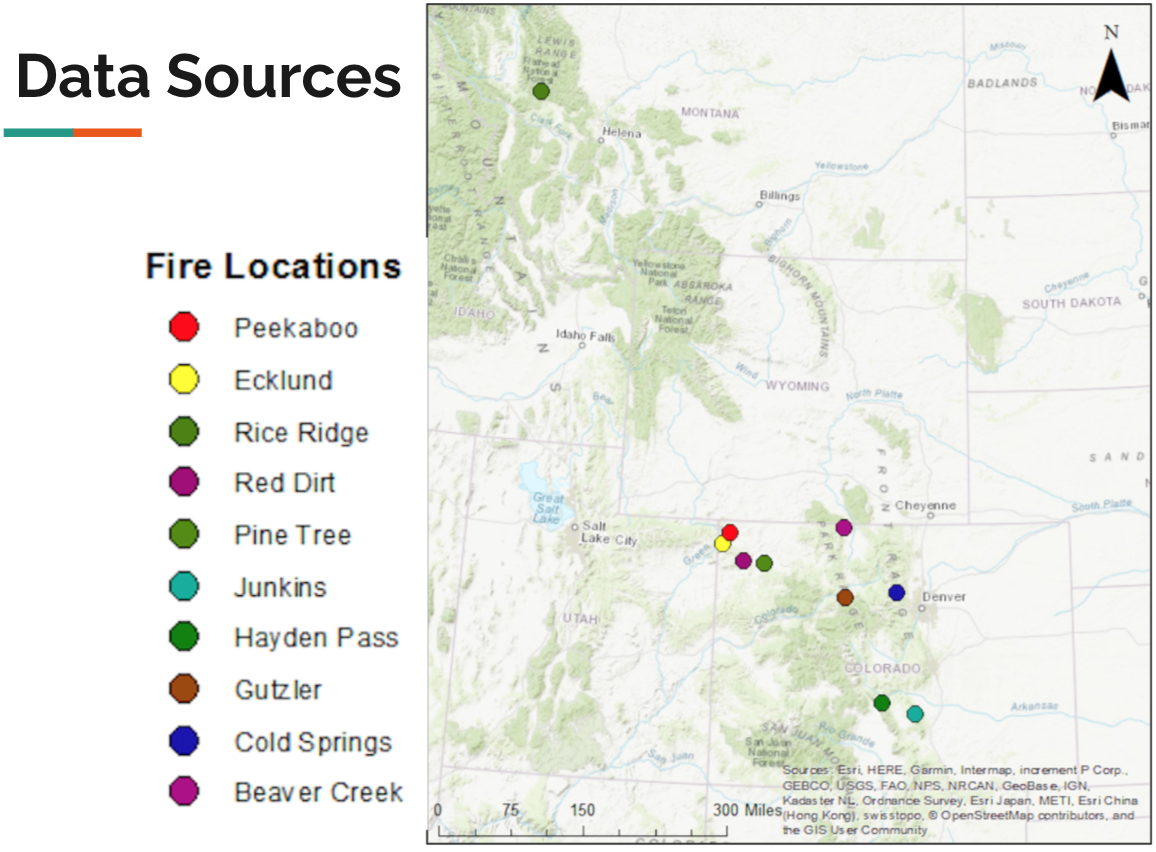
Data Sources
Our model trained on historical data from 10 fires from the past several years (This is tiny in the machine learning world, and probably one of the reasons our results weren't that impressive.) You can see a map of these fires below.
For each of these fires, we compiled a set of historical data. This data consisted of two types: weather, and geospatial.
The historical weather data we pulled from a NOAA (National Oceanic and Atmospheric Administration) archive. We used the HRRR (High Resolution Rapid Refresh) weather model, which produces hourly data across the continental US. It has a spatial resolution of three kilometers, which is pretty fine grained. This weather data included measurements of precipitation, humidity, temperature, wind speed, and wind direction.
The geospatial data consisted of three types: an elevation model, satellite imagery, and fire perimeters. We pulled a digital elevation model (a topographic map) from a USGS database. We used satellite imagery from the LandSat8 satellite, which gave us imagery in the visible spectrum (red, green, blue), as well as near-infrared. The final piece of geospatial data was the daily recordings of the fire perimeters of each of these fires. We pulled this from the USGS's GeoMAC (Geospatial Multi-Agency Coordination) initiative.
Preprocessing
Because we have a bit of domain knowledge about how wildfires work, we were able to take our raw data above and calculate some derived features that we thought the network would find useful in predicting fire spread.
For instance, from the LandSat8 red and near-infrared bands of data we derived another layer of data, called NDVI. NDVI which stands for Normalized Difference Vegetation Index, is basically an indicator of how much plant growth there is. From the the elevation model we extracted two derived layers of data that are important to fire spread: slope angle (steepness), and aspect (which compass direction the hill faces). We transformed the hourly precipitation data by computing the total accumulated precipitation for the previous 24 hours. We averaged the temperature and humidity.
The wind data from the weather data wasn't in a very friendly format, since it represented with with a compass direction and speed. Neural networks wouldn't play well with the "rollover": although 359 degrees and 1 degrees are only separated by 2 degrees, as numbers they are very far apart. Therefore we came up with a metric which basically answers the question "how much did the wind blow to the East this day?" (as well as for North, West, and South). This is a much more meaningful metric from the perspecitve of wildfire growth, and it's in a friendlier format for the network. If this number is high, then the fire will probably grow to the East. We calculated this by looking at the data for each hour of that day, and for each doing some trigonometry to figure out "how much is this wind blowing East?", weighting this by how strong the wind was then, and adding up all of these components. To this day this metric is one of my favorite algorithms that I've come up with.
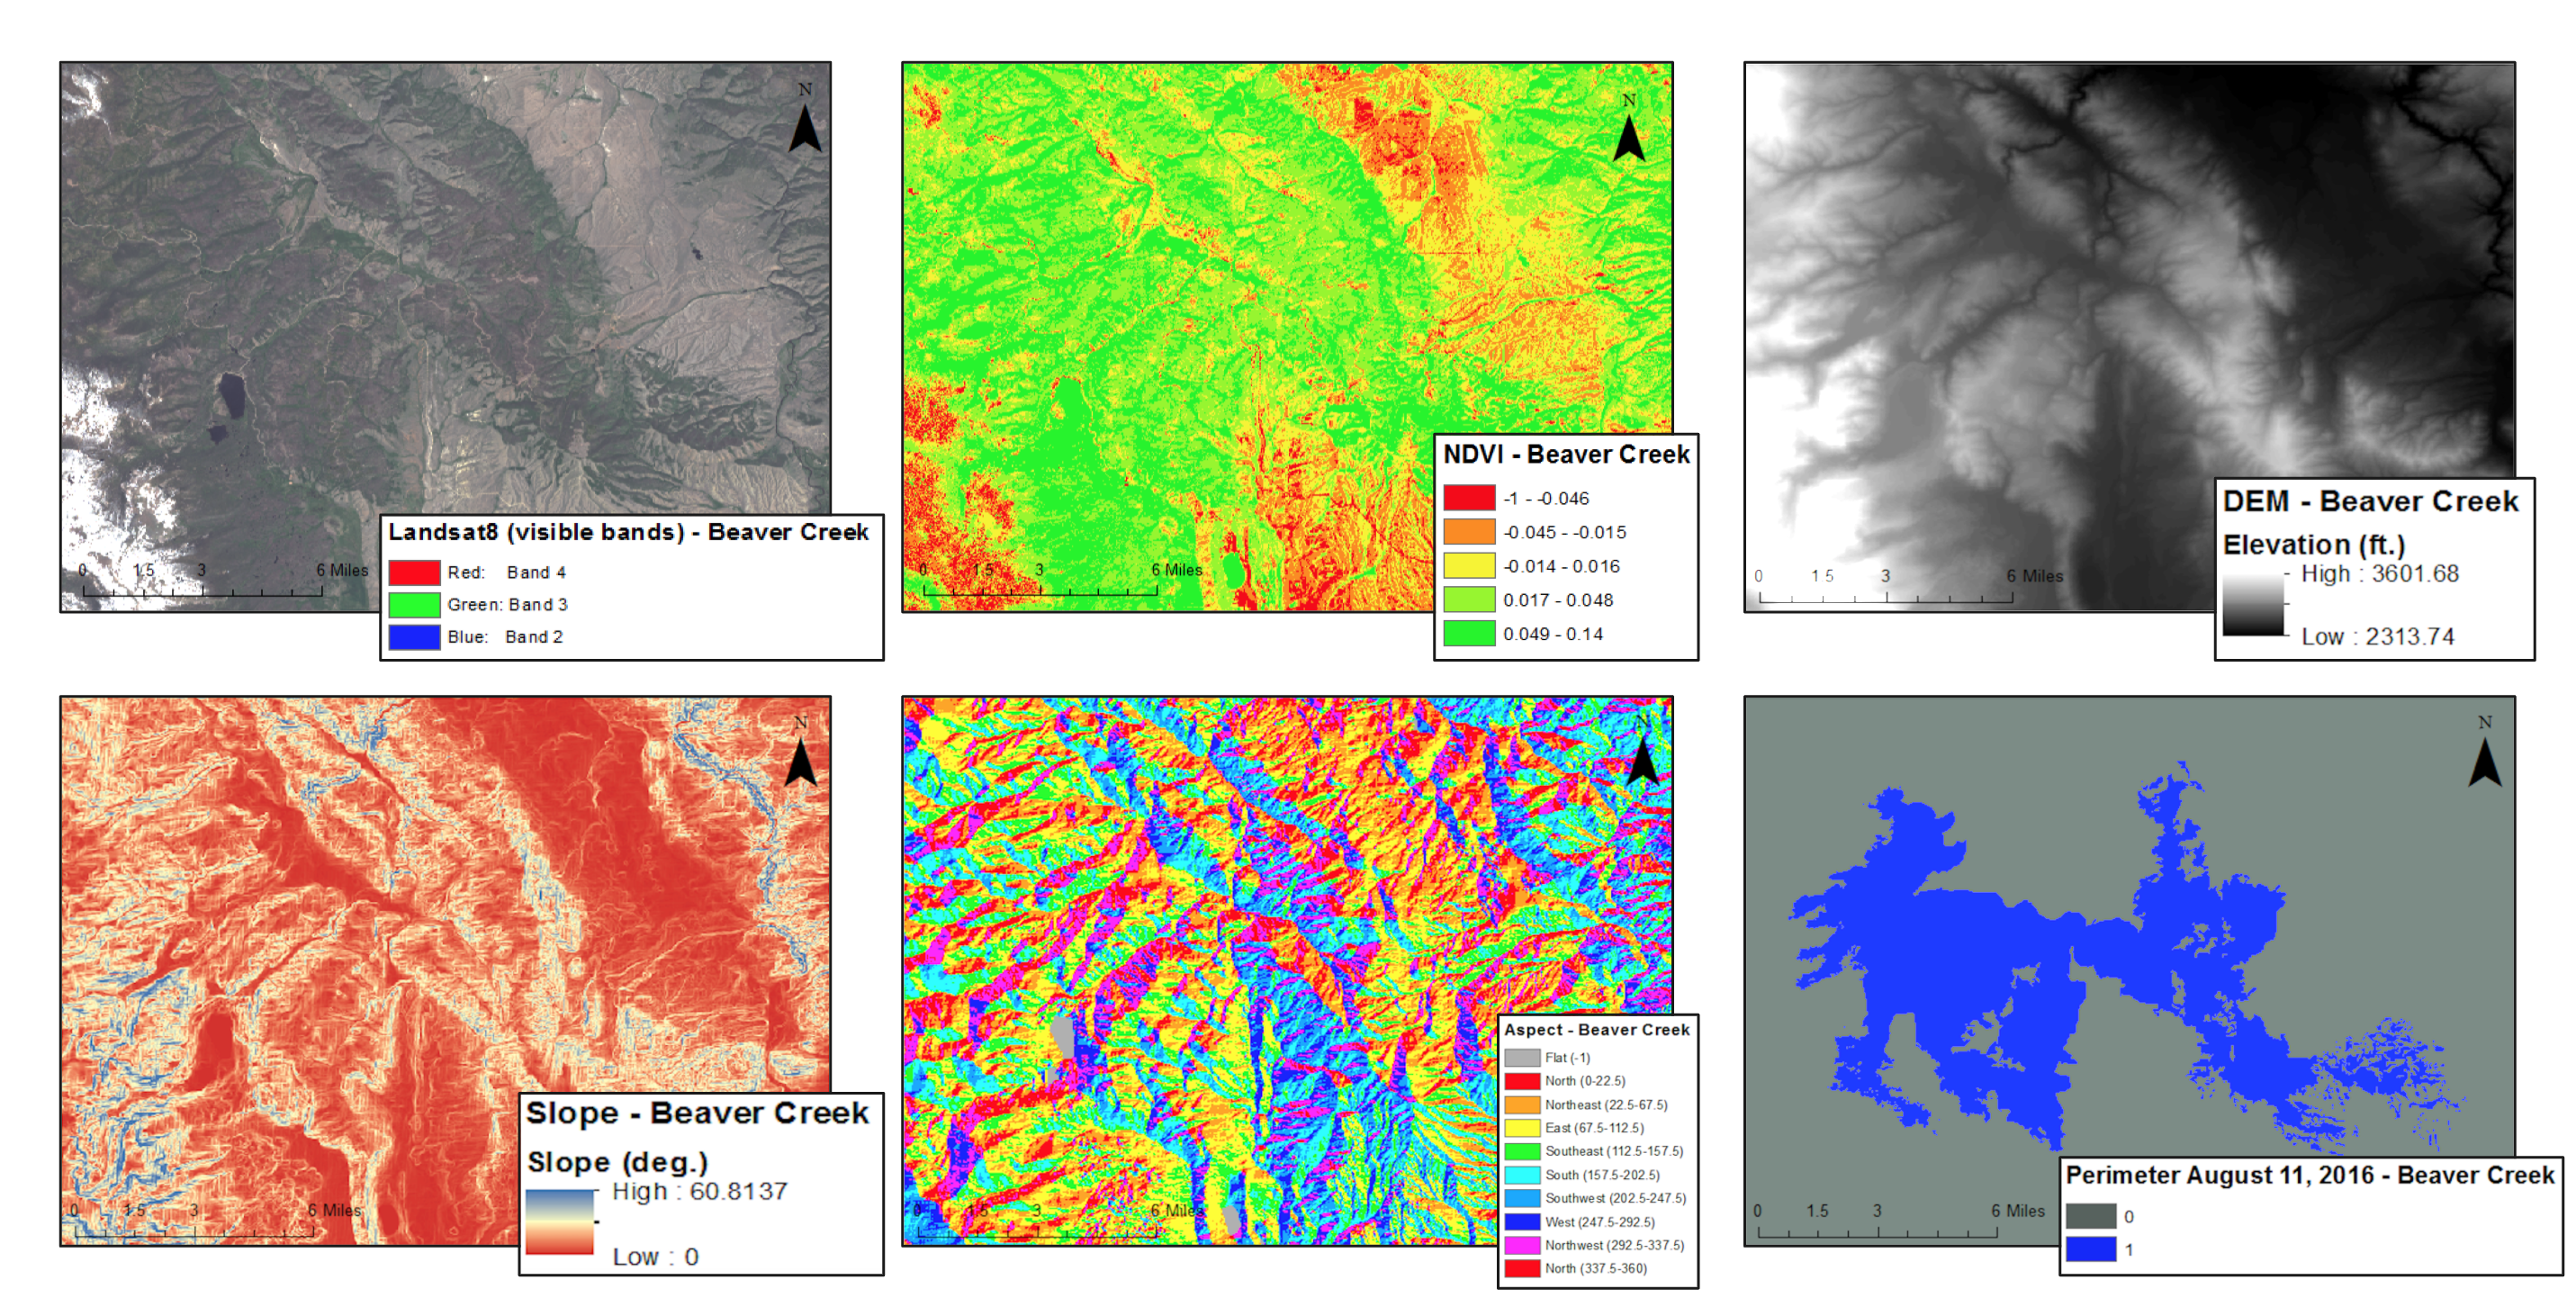
Above are the 6 spatial inputs to the model (clockwise from top left): Satellite imagery, vegetation classification (NDVI), a digital elevation model, slope angle, slope aspect, historical fire perimeters.
We unified the spatial data so that it had the same resolution and covered the same area. We also did the standard preprocessing step of normalizing the range of data so that each channel had a mean of 0 and a standard deviation of 1. Finally, we expanded our training set by augmenting our data, adding random rotations and small scalings to the spatial data, as well as adding some random noise to everything.
Methods
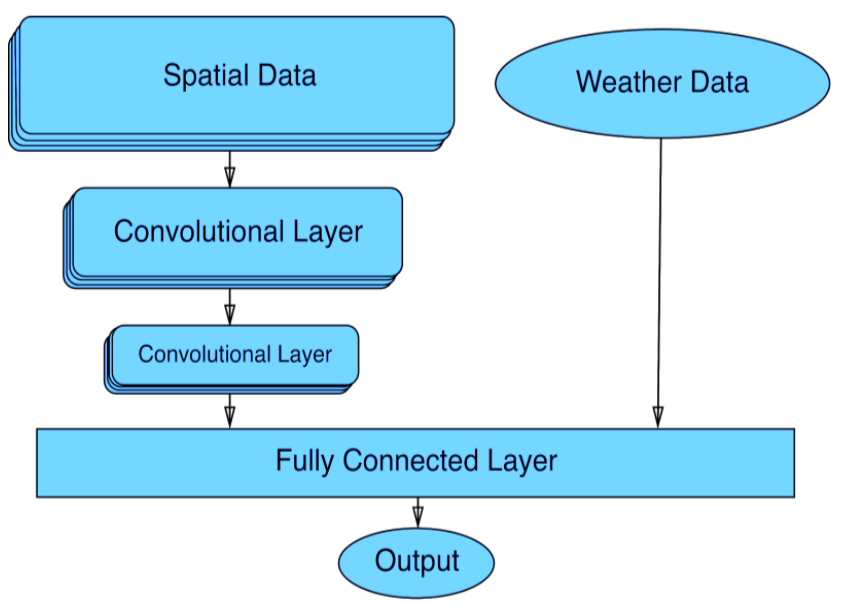
We took this data and fed it into an artificial neural network. Specifically, we used a convolutional neural network (CNN), because those are better suited for processing spatial data. Below you can see the architecture of our model. At the end of the convolutions we merged in the weather data (because it is non-spatial it shouldn't be included in the convolutions).
The output of the model is a map of numbers in the range 0 to 1, 0 meaning the model thinks that area will not burn the next day, and 1 if it thinks it will burn. By training the model on all the historical data, it learned patterns. If you gave it data from a new fire that it had never seen before, then it applies it's past experience and predicts the behavior of this new fire.
Conclusions
I can't claim that our model was actually very good at prediciting wildfire growth, though it did learn a few patterns such as that fires tend to spread uphill (see the first picture), and of course they like vegetated areas. In hindsight, I think there were many things that we didn't do right:
- We didn't have nearly enough data. In evaluation the model might see a set of conditions it had never encountered before. We needed to make our data collection pipeline better so it would have been easier to get more data.
- In hindisght I think we used a pretty stupid architecture. We probably didn't have nearly enough layers. We probably should have used a pre-trained model and used transfer learning to piggy back on the work that experts had used to make great CNNs. I'm not sure if we applied the weather data in the correct place, or if that should have been funneled in earlier in the model.
- We didn't capitalize on all the domain knowledge available. Traditional forest fire models use physics models to solve the problem using bottom-up approach. Our AI technique skips a lot of that domain knowledge, and just maps straight from input to output. Perhaps we should instead take the traditional models and augment them with AI, correcting for their largest errors.
Mostly, I view this project as a success because of all the things we learned:
- A ton about data scraping, cleaning, processing, and augmenting. This is useful knowledge for any sort of project that deals with data, not just machine learning.
- Practice using statistics and data analysis.
- Basics of neural networks.
- Experience with the python libraries NumPy, OpenCV, and Keras.
- Practice using Colorado College's compute cluster.